
As announced in November, we have updated the system for the aggregation of receipt (medical fee) data and used for secondary use.
[Reference] NES: Provision of data that resequent data is re-aggregated data
What is MHLW-NDB?
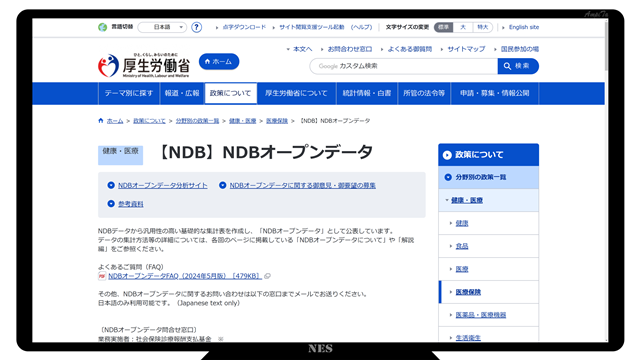
“MHLW-NDB” developed by our company is a system that aggregates NDB open data of the Ministry of Health, Labour and Welfare. It is not open to the public and is a system for our internal use.
The functions can be roughly divided into import, aggregation, and output.
Import
The main import is NDB open data released by the Ministry of Health, Labour and Welfare.
There is a population as an auxiliary data necessary to analyze the medical fee data.
In medical data, there are many data that are expressed in the form of “population one hundred thousand pairs”, so there is a function that can import census data so that the same aggregation can be done.
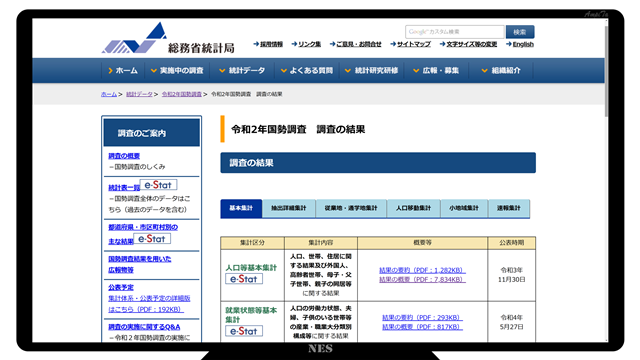
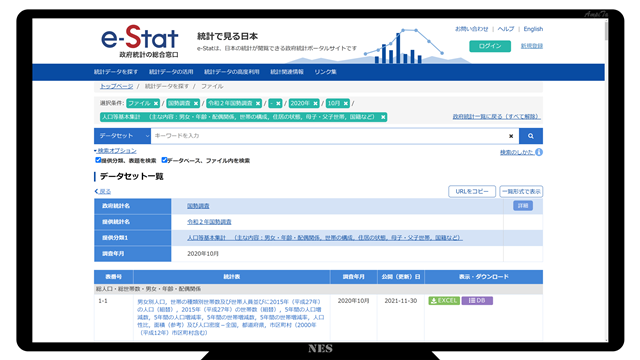
Since the collection data is provided by gender age, prefecture, and secondary medical treatment area, the data of the census is also required by gender, age, prefecture, and secondary medical treatment area.
Since the population data of the census is classified as the total number, man, and woman, the MHLW-NDB database construction allows the total number, man, and woman to be distinguished.
Since data by municipality is required, it is possible to distinguish data by prefecture and municipality.
Because these data must be age-specific, we have data by age in the MHLW-NDB database.
The census provides one-year-old age data, but since the receipt data is by five-year-old class, we have built a database by gender and age according to the classification of the receipt data.
Aggregation
It automatically aggregates the primary when importing data.
Raw data is recorded in the database as the number of calculations and the number of patients, but at the same time, medical expenses are calculated and recorded by multiplying the medical fee (number of points). In addition, the share rate is calculated and recorded.
The share rate is the percentage of the total. In the case of the prefecture aggregation, the percentage of the prefecture in the country total is shown.
Our business is a business that promotes the commercialization of medical engineering. When you think about where sales are effective in doing business, you need to know the area with a high share rate. If there is an age difference, you can see who should be targeted and develop it.
New aggregations
In this update, a new aggregation method has been added. Two new functions, population ratio and aggregation, are being added.
The population ratio is divided by the population data of the census, and the result is divided by one hundred thousand, and the population is divided into “population one hundred thousand pairs”. Record the number of calculations and medical expenses for one hundred thousand people in the database.
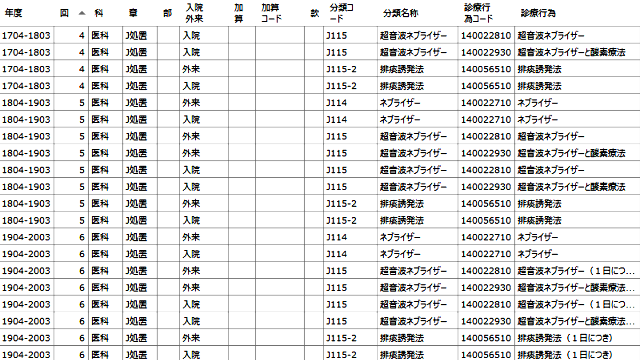
Aggregation is a function that aggregates data from the same year and the same code. In NDB, inpatients and outpatients are aggregated separately, so there are multiple cases of the same medical treatment (code), so it is irrational to use the data twice.
Therefore, we have equipped a function to summarize with the medical treatment code. This made it easier to compile the annual data.
Output
It has two output functions: screen output and external output.
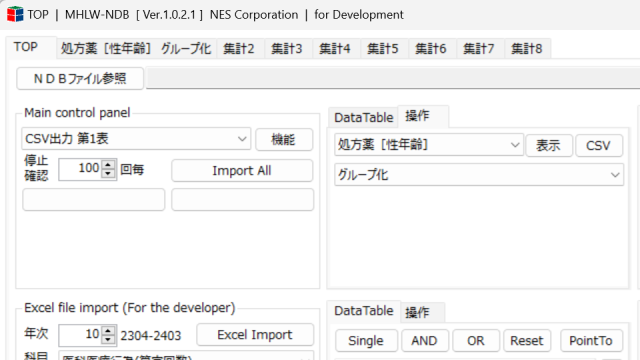
It has a data grid view that can be displayed by switching between standard (raw data) databases, population division databases, and centralized databases.
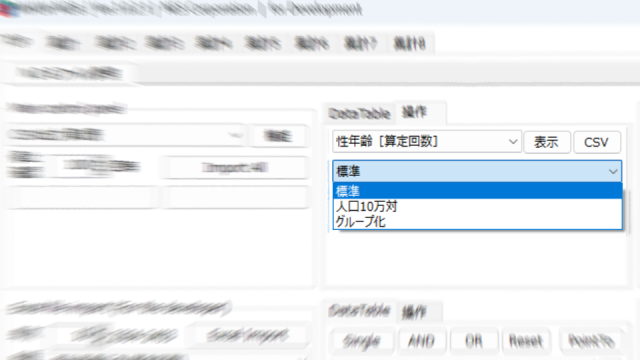
Select the database name, select the type of data, and press the “View” button to display the list (Data Grid View) as shown below.
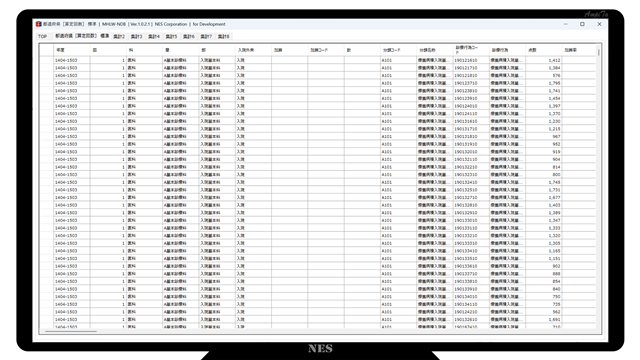
The list (Data Grid View) has a function to output as a CSV file as it is.
Instead of outputting the database itself, you can also output the data after the narrowing process by outputting the list (data grid view).
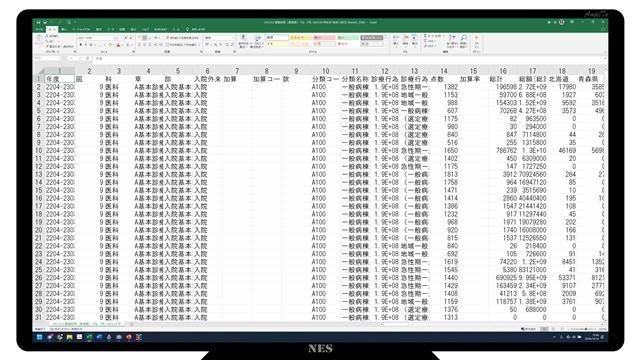
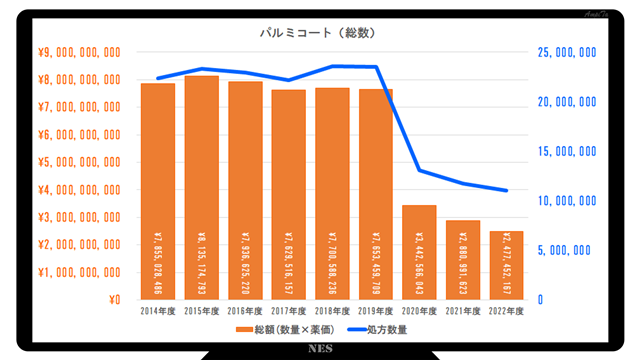
Since CSV files can be treated as Excel files, it is also easy to create graphs as shown in the figure below.
Display Liquidity
In the previous system, there was a list (data grid view) by data type. Each tab is prepared as shown in the figure below.
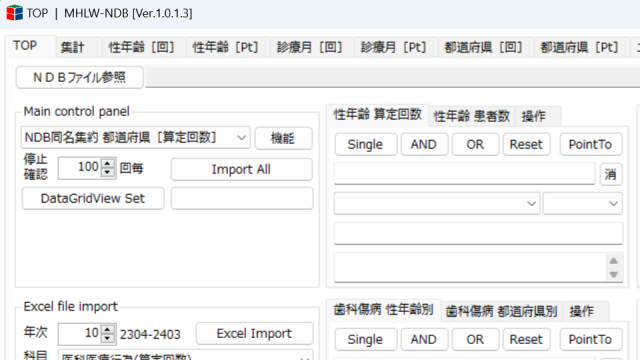
There were many types of data, and since we added a aggregation method, many tabs sounded too much, so we decided to share the list (Data Grid View).
The list (Data Grid View) is available in eight parts, and arbitrary data can be applied to each.
Decimal point
We made some small changes in this update.
Previously, I had cut down to a decimal point. Technically, the data type was Int and Long, but some have changed it to Type Double.
For the display, in the case of the Double type, the instruction “#,0.00” was added to display up to the second decimal place below the decimal point.
In conclusion
In this update, as a consultant, we made adjustments to make it easier to use the data twice.
This system itself is not used outside the company, but we focused on speed and visibility so that data can be shown during conversation at the consulting destination.
We will strive for high-quality consulting by utilizing our own database that is not found in other companies.