The damage assumption of the Nankai Trough mega-earthquake has been updated.
Nankai Trough Earthquake Disaster Prevention Measures
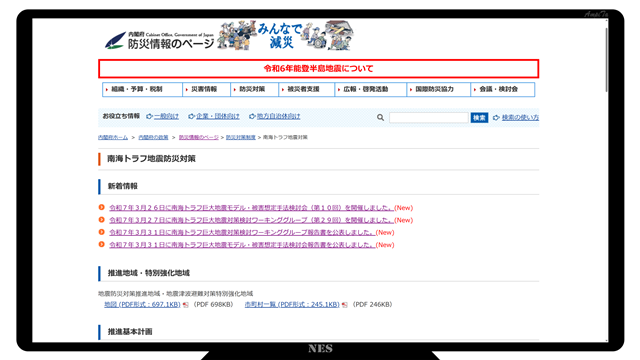
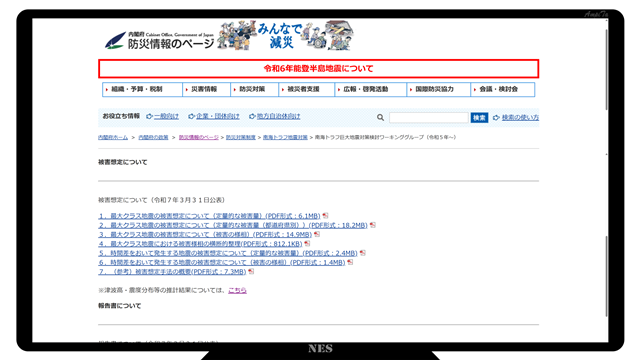
There is a special page called “Nankai Trough Earthquake Disaster Prevention Measures” in charge of disaster prevention at the Cabinet Office.
This time, I will write based on the information posted on the page.
Nankai Trough Earthquake Countermeasures Working Group
There is a Working Group (WG) to consider countermeasures against the Nankai Trough mega-earthquake.
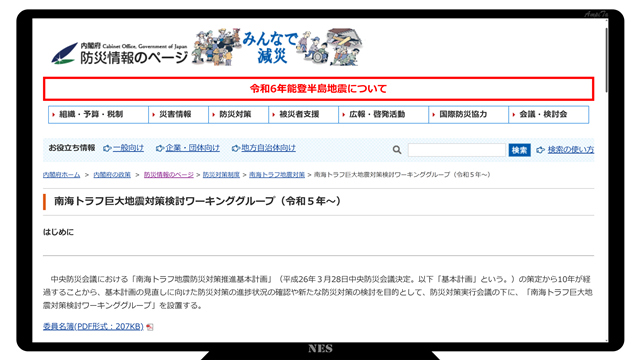
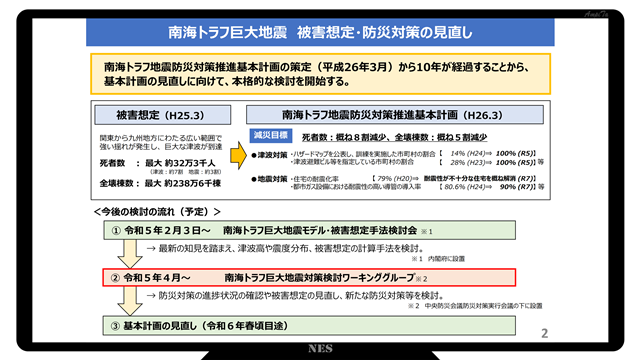
Ten years have passed since the formulation of the Nankai Trough Earthquake Disaster Prevention Measures Promotion Basic Plan in March, and this WG was established to conduct full-scale consideration for the review of the Basic Plan.
The first meeting was held on April 4, 2023. In addition to the committee members, Minister Tani, Deputy Minister Hoshino, Mr. Sakaki, Policy Chief Executive Officer, and Mr. Kamimura, Deputy Secretary-General, are in attendance.
The WG members are as follows. The text may not be accurate due to the use of automatic translation.
| Isouchi Chimasako | Kagawa University | Special Associate Professor |
| Takako Ide | Seikei University School of Economics | Professor |
| Fumihiko Imamura | International Research Institute for Disaster Science, Tohoku University | Professor |
| Sayaka Irie | Matsumoto University Regional Disaster Prevention Research Institute | Professor |
| Yoshihiro Okumura | Kansai University School of Social Safety | Professor |
| Toshitaka Katada | The University of Tokyo Information Science Circle | Specially Appointed Professor |
| Takaaki Kato | Institute of Industrial Science, The University of Tokyo | Professor |
| Noboru Koshizuka | The University of Tokyo Information Science Circle | Professor |
| Hirosako Komuro | Tokyo International University Faculty of Language and Communication | Vice President Dean and Professor |
| Maki Koyama | Gifu University Basin Science Research Center | Associate Professor |
| Mayumi Sakamoto | Graduate School of Disaster Mitigation and Reconstruction and Policy Studies, Hyogo Prefectural University | Professor |
| Noriko Suematsu | Suzuka City, Mie Prefecture | Mayor |
| Naoya Sekiya | The University of Tokyo Information Science and Disaster Management Research Center | Associate Professor |
| Katsumasa Tajima | Kushimoto-cho, Wakayama Prefecture | Mayor |
| Keiji Nemoto | Chubu Economic Federation | Managing Director |
| Shoji Hamada | Ten prefectural governors’ meeting to strongly advance preparations for ultra-wide-area disasters caused by the Nankai Trough earthquake | Representative caretaker (Governor of Kochi Prefecture) |
| Nao Hirata | The University of Tokyo | Professor Emeritus |
| HIROI Kei | Disaster Prevention Research Institute, Kyoto University | Associate Professor |
| Nobuo Fukuwa | Nagoya University | Professor Emeritus |
| Hiroyuki Watanabe | Aeon Corporation | Executive Vice President |
[Reference] Cabinet Office (in charge of disaster prevention): Working group on the Nankai Trough’s earthquake countermeasures (Reiwa 5th year-)
[Reference] Cabinet Office (in charge of disaster prevention): Working Group on the Nankai Trough Earthquake Countermeasures 1st
Damages Assumptions
The damage assumptions released on March 31, 2025 are made up of the following materials:
- About the damage estimation of the maximum class earthquake (quantitative damage amount) *.101pages
- About the damage estimation of the maximum class earthquake (quantitative damage amount (by prefecture)) *.428pages
- About the damage assumption of the maximum class earthquake (spects of damage) *.197pages
- Cross-sectional organization of damage in the largest class earthquake *.11pages
- About the damage estimation of the earthquake that occurs with the time difference (quantitative damage amount) *.35pages
- About the damage assumption of the earthquake that occurs with the time difference (spects of damage) *.55pages
- (Reference) Outline of the damage estimation method *.87pages
The report, also published on March 31st, is the following file:
- Nankai Trough Earthquake Countermeasures Study Working Group Report Summary *.1page
- Nankai Trough Earthquake Countermeasures Study Working Group Report
- Nankai Trough Earthquake Countermeasures Working Group Report *.141pages
- Separate book References1 Activities related to measures in the Nankai Trough Earthquake Disaster Prevention Measures Promotion Policy *.44pages
- Separate book Reference 2 Case studies on measures against the Nankai Trough earthquake *.324pages
Scene
This time, there were three types of targets: “Winter / Midnight”, “Summer / Daytime”, “Winter / Evening”.
Winter and late night
- Many people are affected while sleeping at home, so there is a high risk of deaths from house collapses, and evacuations from the tsunami are delayed.
- There are few residences in offices and downtown areas, as well as railway and road users.
- The indoor residence population is almost constant in the middle of the night to early morning hours
Summer and Lunch
- There are many people who are staying in offices, downtown areas, etc., and there are many cases where there are cases of damage outside the home.
- The number of people staying in wooden buildings is small in the day, and the number of deaths due to the collapse of old wooden houses is small compared to scene one.
- The residence population in the wooden building is almost constant from 10 o’clock to 15 o’clock in the afternoon
- There are many tourists, including swimmers, in coastal areas.
Winter and evening
- It is the time when the use of fires is most often used in houses and restaurants, and the number of fires is the largest.
- In addition to offices and downtown areas, there are many people who have stayed at the terminal station.
- Railways and roads are also almost close to the rush to return home, and the impact of human casualties and obstruction of traffic functions is significant.
Damaged items
- Damage to buildings, etc.
- 1.1. Damage caused by shaking
- 1.2. Damage caused by liquefaction
- 1.3. Damage caused by the tsunami
- 1.4. Damage caused by the collapse of the steep sloped land
- 1.5. Damage caused by earthquake fire
- 1.6. Damage caused by tsunami fires
- Outdoor falls, occurrence of falling objects
- 2.1. Number of falls on block fences, vending machines, etc.
- 2.2. Outbound occurrence of outdoor falling objects
- Human casualties
- 3.1. Damage caused by building collapse
- 3.2. Damage caused by the tsunami
- 3.3. Damage caused by the collapse of the steep sloped land
- 3.4. Damage caused by the fire
- 3.5. Falling block fences and vending machines, damage caused by outdoor falling objects
- 3.6. Damage caused by moving or falling indoor housing, falling objects
- 3.7. Rescuers associated with building damage due to shaking (difficulty in escaping on their own)
- 3.8. Rescuers and searchers associated with tsunami damage
- 3.9. Damage-related death
- Lifeline damage
- 4.1. Water supply
- 4.2. Sewage
- 4.3. Power
- 4.4. Information and communication (telephone, Internet, etc.)
- 4.5. Gas (city gas)
- Traffic facilities damaged
- 5.1. Roads (highways, general roads)
- 5.2. Railways
- 5.3. Ports
- 5.4. Airports
- Impact on life
- 6.1. Evacuees
- 6.2. Difficult to return home to.
- 6.3. Supplies
- 6.4. Medical functions
- 6.5. Health and hygiene, infectious diseases, response to the body, etc. [This time not eligible]
- 6.6. Various life services [This time not eligible]
- Disaster waste, etc.
- 7.1. Disaster waste, etc.
- and other damage.
- 8.1. Locked in the elevator.
- 8.2. Long-period earthquake motion [This time not eligible]
- 8.3. Road blockage
- 8.4. Rockfalls and debris falling on cars on the road [Excluding this time]
- 8.5. Traffic injuries (roads) [This time not eligible]
- 8.6. Traffic injury (railway) [Extracursion]
- 8.7. Concerned people.
- 8.8. Residential land construction site [Extrapped this time]
- 8.9. Hazardous materials and industrial complexes
- 8.10. Large-scale customer attraction facilities, etc. [This time not eligible]
- 8.11. Underground mall and terminal station [Except this time]
- 8.12. Cultural Heritage
- 8.13. Isolated settlements
- 8.14. Emergency measures, etc. [This time not eligible]
- 8.15. Breakdown of dams, ponds for agriculture, etc. [Excluding this time]
- 8.16. Long-term water due to ground subsidence [This time not eligible]
- 8.17. Combined Disasters [Extraordinary Discharges This Time]
- 8.18. Damage to fishing boats, ships, and fishery-related facilities [Except this time]
- 8.19. Security [Extraordinary this time]
- Damage amount
- 9.1. Damage to assets, etc.
- 9.2. Impact of Decreased Production and Service
- 9.3. Impact of traffic disruption
- Damage scenarios according to the characteristics of the region [This time not eligible]
Representative damage assumptions
The following items were listed as typical damage assumptions.
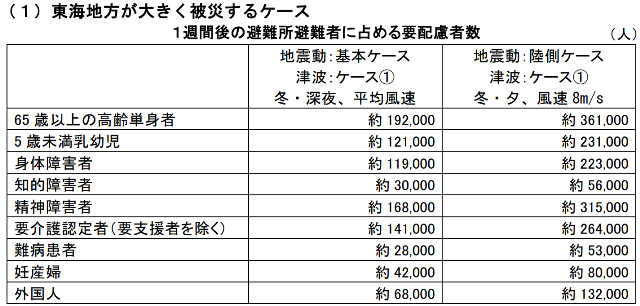
Cases in which the Tokai region is greatly damaged
The building damage assumption is that the seismic movement case is basically, the tsunami case is the case1, the wind speed is 8m/s, and the levee and sluice gate functioned normally in response to the earthquake motion.
The human casualties are those with a low early evacuation rate and 8m/s wind speed against the tsunami.
| Item | Winter and late night | Summer and Lunch | Winter and evening |
|---|---|---|---|
| Total number of destroyed and burned-out buildings | 986,000 homes | 994,000 homes | 1,214,000 homes |
| ├ Total destruction due to shaking | 610,000 homes | Left-same | Left-same |
| ├ Total destruction due to liquefaction | 94,000 homes | Left-same | Left-same |
| ├ Total destruction due to tsunami | 193,000 homes | Left-same | Left-same |
| ├ Total destruction due to sudden sloped land collapse | 4,600 homes | Left-same | Left-same |
| ├ Burned by earthquake fire | 84,000 homes | 91,000 homes | 311,000 homes |
| Total number of half-destroyed buildings | 1,896,000 homes | 1,893,000 homes | 1,840,000 homes |
| Tsunami fire | 400items | Left-same | Left-same |
| Total number of dead | From 126,000 247,000 people | From 66,000 192,000 people | From 81,000 204,000 people |
| ├ Deaths from building collapse | 35,000 people | 17,000 people | 26,000 people |
| ├ Deaths from tsunami | 208,000 people | 173,000 people | 169,000 people |
| ├ Deaths due to sudden sloping ground collapse | Four hundred people. | Two hundred people. | Three hundred people. |
| └ Deaths from earthquake fires | 3,500 people | 1,700 people | 8,300 people |
| Number of injured | From 330,000 346,000 people | From 518,000 533,000 people | From 350,000 364,000 people |
| The rescuer. (Difficult to escape on their own) | 139,000 people | 113,000 people | 123,000 people |
| Rescuers in need of tsunami damage | From 62,000 63,000 people | From 65,000 67,000 people | From 63,000 64,000 people |
| Disaster-related deaths | – | – | 26,000 to 52,000 people |
Cases in which the Kinki region is greatly damaged
The building damage assumption is that the seismic movement case is basically, the tsunami case is the case3, the wind speed 8m/s, and the levee and sluice gate functioned normally against the seismic motion.
The human casualties are those with a low early evacuation rate and 8m/s wind speed against the tsunami.
| Item | Winter and late night | Summer and Lunch | Winter and evening |
|---|---|---|---|
| Total number of destroyed and burned-out buildings | 985,000 homes | 992,000 homes | 1, 290,000 homes |
| ├ Total destruction due to shaking | 610,000 homes | Left-same | Left-same |
| ├ Total destruction due to liquefaction | 94,000 homes | Left-same | Left-same |
| ├ Total destruction due to tsunami | 193,000 homes | Left-same | Left-same |
| ├ Total destruction due to sudden sloped land collapse | 4,600 homes | Left-same | Left-same |
| ├ Burned by earthquake fire | 83,000 homes | 89,000 homes | 306,000 homes |
| Total number of half-destroyed buildings | 1,874,000 homes | 1,871,000 homes | 1,821,000 homes |
| Tsunami fire | Three hundred. | Left-same | Left-same |
| Total number of dead | From 92,000 232,000 people | From 41,000 181,000 people | From 59,000 194,000 people |
| ├ Deaths from building collapse | 35,000 people | 17,000 people | 26,000 people |
| ├ Deaths from tsunami | 193,000 people | 162,000 people | 159,000 people |
| ├ Deaths due to sudden sloping ground collapse | Four hundred people. | Two hundred people. | Three hundred people. |
| └ Deaths from earthquake fires | 3,500 people | 1,700 people | 8,300 people |
| Number of injured | From 327,000 341,000 people | From 516,000 531,000 people | From 348,000 362,000 people |
| The rescuer. (Difficult to escape on their own) | 139,000 people | 113,000 people | 123,000 people |
| Rescuers in need of tsunami damage | From 72,000 73,000 people | From 79,000 81,000 people | From 74,000 76,000 people |
| Disaster-related deaths | – | – | From 14,000 28,000 people |
Cases in which the Shikoku region is greatly damaged
The building damage assumption is that seismic motion cases are basically, tsunami cases are 4cases, wind speed 8m/s, and levee and sluice gates have been successfully performed against seismic motion.
The human casualties are those with a low early evacuation rate and 8m/s wind speed against the tsunami.
| Item | Winter and late night | Summer and Lunch | Winter and evening |
|---|---|---|---|
| Total number of destroyed and burned-out buildings | 972,000 homes | 979,000 homes | 1,198,000 homes |
| ├ Total destruction due to shaking | 610,000 homes | Left-same | Left-same |
| ├ Total destruction due to liquefaction | 94,000 homes | Left-same | Left-same |
| ├ Total destruction due to tsunami | 179,000 homes | Left-same | Left-same |
| ├ Total destruction due to sudden sloped land collapse | 4,600 homes | Left-same | Left-same |
| ├ Burned by earthquake fire | 83,000 homes | 91,000 homes | 310,000 homes |
| Total number of half-destroyed buildings | 1,869,000 homes | 1,866,000 homes | 1,815,000 homes |
| Tsunami fire | Three hundred. | Left-same | Left-same |
| Total number of dead | From 70,000 188,000 people | From 30,000 144,000 people | From 48,000 157,000 people |
| ├ Deaths from building collapse | 35,000 people | 17,000 people | 26,000 people |
| ├ Deaths from tsunami | 149,000 people | 124,000 people | 122,000 people |
| ├ Deaths due to sudden sloping ground collapse | Four hundred people. | Two hundred people. | Three hundred people. |
| └ Deaths from earthquake fires | 3,500 people | 1,700 people | 8,300 people |
| Number of injured | From 326,000 339,000 people | From 515,000 528,000 people | From 348,000 359,000 people |
| The rescuer. (Difficult to escape on their own) | 139,000 people | 113,000 | 123,000 people |
| Rescuers in need of tsunami damage | From 60,000 62,000 people | From 64,000 67,000 people | From 60,000 63,000 people |
| Disaster-related deaths | – | – | From 14,000 27,000 people |
Cases in which the Kyushu region is greatly affected
The building damage assumption is that the seismic motion case is basically, the tsunami case is the case five, the wind speed 8m/s, and the levee and sluice gate functioned normally against the seismic motion.
The human casualties are those with a low early evacuation rate and 8m/s wind speed against the tsunami.
| Item | Winter and late night | Summer and Lunch | Winter and evening |
|---|---|---|---|
| Total number of destroyed and burned-out buildings | 1,001,000 homes | 1,009,000 homes | 1,228,000 homes |
| ├ Total destruction due to shaking | 610,000 homes | Left-same | Left-same |
| ├ Total destruction due to liquefaction | 94,000 homes | Left-same | Left-same |
| ├ Total destruction due to tsunami | 208,000 homes | Left-same | Left-same |
| ├ Total destruction due to sudden sloped land collapse | 4,600 homes | Left-same | Left-same |
| ├ Burned by earthquake fire | 84,000 homes | 91,000 homes | 310,000 homes |
| Total number of half-destroyed buildings | 1,866,000 homes | 1,863,000 homes | 1,812,000 homes |
| Tsunami fire | Three hundred. | Left-same | Left-same |
| Total number of dead | From 92,000 231,000 people | From 41,000 181,000 people | From 59,000 194,000 people |
| ├ Deaths from building collapse | 35,000 people | 17,000 people | 26,000 people |
| ├ Deaths from tsunami | 151,000 people | 126,000 people | 124,000 people |
| ├ Deaths due to sudden sloping ground collapse | Four hundred people. | Two hundred people. | Three hundred people. |
| └ Deaths from earthquake fires | 3,500 people | 1,700 people | 8,400 people |
| Number of injured | From 325,000 338,000 people | From 515,000 527,000 people | From 347,000 359,000 people |
| The rescuer. (Difficult to escape on their own) | 139,000 people | 113,000 people | 123,000 people |
| Rescuers in need of tsunami damage | From 62,000 64,000 people | From 62,000 65,000 people | From 60,000 63,000 people |
| Disaster-related deaths | – | – | From 14,000 28,000 people |
[Reference] Central Disaster Prevention Conference: Nankai Trough Giant Earthquake Damage Estimates in Maximum Class Earthquakes, Summary Table, p13
[Reference] Central Disaster Prevention Conference: Nankai Trough Giant Earthquake: Damages in the largest class earthquake, Human casualties, p18
Disaster-related deaths
This time, for the first time, disaster-related death data was shown.
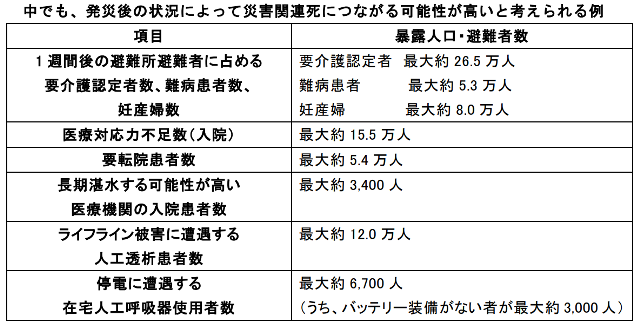
The table above translates as follows.
| Item | Disaster Victims and Evacuees |
|---|---|
| Vulnerable health as a percentage of shelter evacuees after one week | primary nursing care: 265,000 incurable disease: 53,000 pregnant woman: 80,000 |
| Inpatients who cannot respond to medical care | 155,000 |
| Patients requiring transfer | 54,000 |
| Inpatients in hospitals that are flooded for long periods of time | 3,400 |
| Dialysis Patients Suffering from Lifeline Disruption | 120,000 |
| Patient on home ventilator suffers power outage | 6,700 |
I don’t know if it’s right as data, but I think it makes sense to have a guide. The description of the data is as follows.
- Number of certified caregivers, intractable diseases, and pregnant women:
- Among the results of the calculation of “sensitive persons”, it is considered that it is particularly likely to lead to danger of life
- Number of medically incompetent (hospitalization):
- It is the result of the calculation of “medical function hindrance”, and the number of people who can not be accepted in the hospital bed where there was no damage among the hospitalized patients before the disaster and those who were seriously injured in the earthquake (including those who died at medical institutions)
- Number of patients in the hospital:
- The number of people who can not be continuously hospitalized at the medical institution that was hospitalized before the accident is calculated at the time of calculation of “medical function hindrance”
- Number of hospitalized patients at medical institutions likely to be long-term water-capped:
- Among the medical institutions that are flooded by the tsunami, the number of hospitalized patients in the low-level area (areas with lower altitude and difficult drainage than the surrounding area)
- Number of dialysis patients encountering lifeline damage:
- Number of dialysis patients encounter power outages or water outages
- Number of home ventilators encounter power outages:
- The number of home ventilator users who encounter a power outage is aggregated according to the presence or absence of battery equipment
The second item, “Insufficient medical capacity (hospitalization)” is an important number related to “medical care in times of disaster” that we are focusing on.
Until now, it is thought that the regional disaster prevention plan formulated by the local government has not mentioned patients who have been hospitalized even before the disaster. Since medical care in peacetime is a private business, and in some respects, it is the pursuit of profit, so each hospital is responsible for dealing with hospitalized patients after the disaster, which is an extension of that, but at the same time, there were many medical institutions that were forced to take on the challenge of accepting the injured that occurred in the area.
Although it is a rough figure of 15.5 million people, it is thought that considerable preparation is necessary because the number of people who are judged to be hospitalized is overflowing with 15.5 million people.
Disaster-related deaths of children and people in medical care
I believe that the estimated that one-third of dialysis patients will encounter lifeline damage will be dealt with by related organizations such as the Dialysis Medical Association and the Dialysis Medical Association.
At our company, we conduct simulations assuming lifeline disruptions and make presentations at academic conferences. I believe that it is necessary to clarify the hazard risks faced by dialysis in the affected areas and to take sufficient measures.
I think that it will be useful for patients if you can think about the way of support dialysis.
Damages were also made for patients with home-based ventilator therapy.
The maximum number of home ventilators who encounter power outages is “up to about six,700”, and it is estimated that those who do not have a battery are “up to about three thousand people”.
The number of patients estimated by the company is about twenty thousand, and one-third of them are affected by the disaster. The dialysis patients mentioned above were also a third.
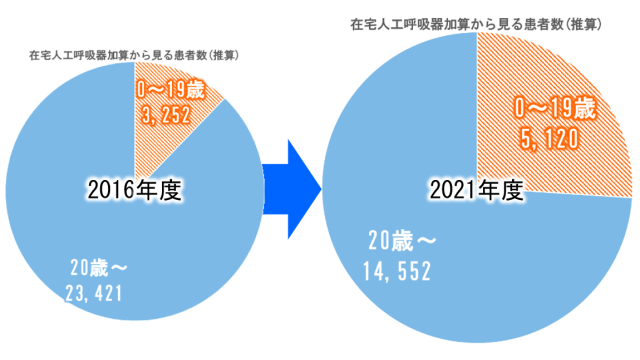
If you look at the number of patients without a battery, it may be the number of affected patients including CPAP.
We conduct simulations and consulting aimed at patients with a type of ventilator who is involved in a life-threat crisis if the ventilator does not operate.
Sleep apnea syndrome is also life-related in the long run, but it is not a match for several hours, so it is removed from focus.
It is important to keep individual patients away from life-threatening, and I believe that the number of thousands of people is large or small will change depending on their preparation.
There are other reports of “caregivers” as well. It seems that the “intractable disease patients” also include patients with a ventilator, but I think that I also have a physical disability certificate, so I do not know where it belongs and whether it is double counted.
[Reference] Central Disaster Prevention Conference: Nankai Trough Earthquake: Damage Estimates in Maximum Class Earthquakes, Disaster-related Deaths, p29
[Reference] Central Disaster Prevention Conference: Nankai Trough Giant Earthquake Assume damage in the largest class earthquake, please considerate, p77
[Reference] NES: Conference presentation slides considering dialysis during water outages (announced in December 2023)
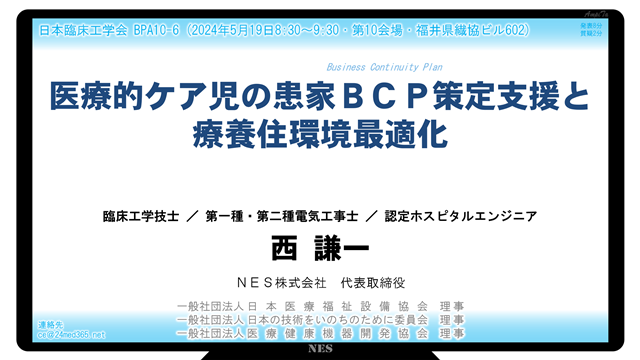
[Reference] NES: BPA Presentation “Support for BCP Formulation of Patients in Medical Care Children and Optimizing the Environment of Sanatorium Living Environment”
[Reference] NES: Best Presentation Award (BPA) Award
Medical functions
Medical institutions in the disaster-stricken areas are affected by damage to buildings and lifelines, while the ability to provide medical care is declining due to the damage and failure of buildings and lifelines, but the supply-demand balance is greatly disrupted due to the frequent number of injuries and the demand for medical care increases.
If the safety of hospitalized patients is not maintained due to the damage of the medical institution, it will be necessary to transfer to the hospital.
In this damage assumption, the expression “the number of patients who are difficult to respond in the affected prefectures” is used to describe the damage, but in the first place, there are few cases where the government specifically entrusts and requests to medical institutions due to the cost, and medical management in peacetime is also in a difficult situation, and I think that it is a reality that it is not possible to deal with new cases of disasters unless it is a disaster base hospital or a municipal hospital.
Therefore, it may be a poor environment because it is already a difficult situation, not a deterioration that “it is difficult to respond”.
As the situation of sleeping small fish in the gymnasium for decades, the medical provision system will not be able to escape serious situations unless a fundamental change comes, as long as the situation where evacuation centers are located in the gymnasiums, the situation of sleeping small fish, will not be resolved.
The worst cases in each region this time are as follows.
| Damaged nuclear comfort | Inadequate hospitalization response | Lack of external response. |
|---|---|---|
| Tokai region | 155,000 people | 223,000 people |
| Kinki region | 153,000 people | 217,000 people |
| Shikoku region | 148,000 people | 215,000 people |
| Kyushu region | 148,000 people | 215,000 people |
Keywords by file
Seven files have been released about the damage.
- About the damage estimation of the maximum class earthquake (quantitative damage amount) *.101pages
- About the damage estimation of the maximum class earthquake (quantitative damage amount (by prefecture)) *.428pages
- About the damage assumption of the maximum class earthquake (spects of damage) *.197pages
- Cross-sectional organization of damage in the largest class earthquake *.11pages
- About the damage estimation of the earthquake that occurs with the time difference (quantitative damage amount) *.35pages
- About the damage assumption of the earthquake that occurs with the time difference (spects of damage) *.55pages
- (Reference) Outline of the damage estimation method *.87pages
The volume of the file is different, but I checked how many medical keywords are in this.
| No. 1 | No. 2 | No.3 | No. 4 | No.5 | No.6 | No. 7 | Total | |
|---|---|---|---|---|---|---|---|---|
| Artificial respiration | 3 | 0 | 2 | 0 | 0 | 0 | 0 | 5 |
| Dialysis | 2 | 0 | 3 | 0 | 0 | 0 | 1 | 6 |
| Suction | 2 | 0 | 4 | 0 | 0 | 0 | 0 | 6 |
| Oxygen | 0 | 0 | 3 | 0 | 0 | 0 | 0 | 3 |
| Senior | 5 | 0 | 20 | 4 | 0 | 3 | 5 | 37 |
| Disability | 12 | 0 | 28. | 2 | 0 | 1 | 6 | 49 |
| Caregivers | 7 | 0 | 38 | 0 | 0 | 7 | 4 | 56 |
| Death | 3 | 0 | 54 | 0 | 0 | 10 | 11 | 78 |
| Injured | 17 | 100 | 12 | 2 | 0 | 2 | 41 | 174 |
| First Aid | 0 | 0 | 1 | 0 | 0 | 0 | 0 | 1 |
| Rescue | 18 | 14 | 49 | 6 | 2 | 3 | 31 | 123 |
| Hospitalized | 17 | 0 | 7 | 1 | 0 | 3 | 6 | 34 |
| Surgery | 0 | 0 | 0 | 0 | 0 | 0 | 0 | 0 |
| Medical | 29 | 0 | 91 | 19 | 1 | 35 | 36 | 211 |
| Medical functions | 5 | 0 | 4 | 1 | 1 | 6 | 6 | 23 |
| Medical Institutions | 12 | 0 | 28. | 3 | 0 | 5 | 20 | 68 |
| Hospital | 5 | 0 | 12 | 3 | 0 | 0 | 9 | 29 |
| Disaster base | 3 | 0 | 2 | 1 | 0 | 0 | 0 | 6 |
| Disasters | 51 | 28. | 255 | 30 | 5 | 48 | 94 | 511 |
| Earthquakes | 293 | 502 | 307 | 14 | 145 | 638 | 210 | 2,109 |
| Tsunami | 352 | 829 | 266 | 34 | 43 | 54 | 212 | 1,790 |
| Fire | 41 | 257 | 72 | 10 | 18 | 10 | 87 | 495 |
| Power outages | 32 | 108 | 136 | 39 | 0 | 9 | 65 | 389 |
| Water-blocking | 17 | 100 | 34 | 11 | 0 | 0 | 18 | 180 |
| Evacuation | 209 | 288 | 486 | 59 | 37 | 237 | 248 | 1,564 |
| Difficulty getting home. | 8 | 2 | 18 | 14 | 1 | 9 | 13 | 65 |
| Lack of | 17 | 0 | 210 | 32 | 0 | 92 | 44 | 395 |
| Road | 43 | 14 | 189 | 32 | 3 | 36 | 105 | 42 2 |
It is reasonable to say that there are overwhelmingly many “earthquakes” as many as 2,109, “tsunami” as 1.790s, and evacuation as 1,564s as much as possible.
I don’t know if it’s better to see whether it’s better to see six “dialysis”s, five respirations, six suctions, and three oxygens as few.
There are thirty-four “hospitalizations” but “operations” are zero. Since there is an assumption that “summer / noon” this time, it is normal that surgery is being performed, but it seems that it did not enter into the assumption.
Disaster Waste and Public Health
Disaster waste is a problem every time a disaster occurs, but it is one of the information that fades when it is at the stage of subsequent transmission.
It is difficult to understand even if you look at the figure of hundreds of millions of tons, and in general, municipalities operate garbage disposal plants, so the problem varies depending on the processing capacity of each municipality.
The Cleanland waste incineration facility in Itami-shi, Toyonaka City, has a processing capacity of 525tons/day (175tons/day). If it works eight hours a day, it stays sixteen hours. In other words, it is estimated that there is a residual capacity of 1,050tons/day. There is a hypothesis that it can process about three hundred and eighty thousand tons in a year, but I think that it is not actually possible to operate at full capacity, so I think it is tens of thousands tons.
The number of vehicles related to transportation when consigned to other cities is unknown. Packer cars often seen in the city need to travel for about two tons of loading capacity, five thousand tonnes, and fifty round trips for one hundred cars for transportation of ten thousand tons.
| Damaged nuclear comfort | Disaster waste | Tsunami deposits |
|---|---|---|
| Tokai region | 40 million tonnes | 240 million tonnes |
| Kinki region | 40 million tonnes | 22 million tonnes |
| Shikoku region | 40 million tonnes | 22 million tonnes |
| Kyushu region | 40 million tonnes | 2.3 million tonnes |
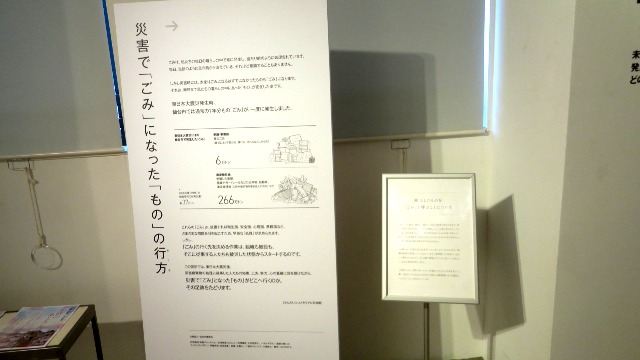
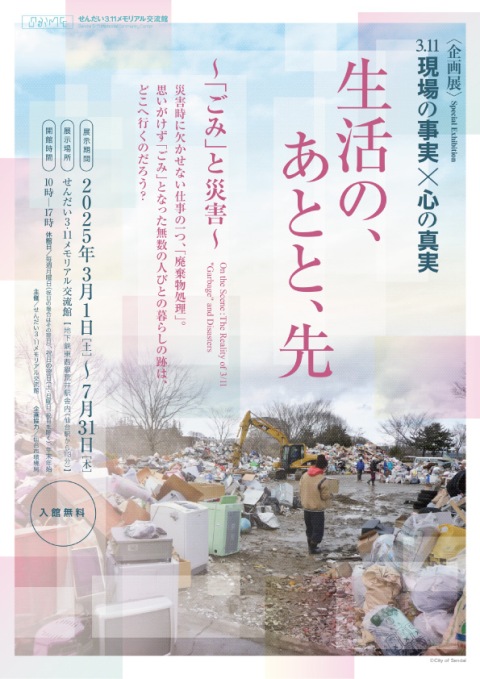
In March 2025, when I visited the Sendai3.11 Memorial Exchange Center in Miyagi Prefecture, we held a special exhibition “Life, After, and Beyond – “Garbage” and Disaster-“.
[Reference] Central Disaster Prevention Conference: Nankai Trough Giant Earthquake Damage Estimates in Maximum Class Earthquakes, Medical Functions, p71
[Reference] Konoike-gumi: Itami City Itami City, Toyonaka City Cleanland Waste Incineration Facility (civil engineering and construction)
[Reference] Sendai 311 Memorial Exchange Hall
Details of the original.
In this article, I was able to list the contents that I read.
In reality, it is necessary to narrow down the target area and implement BCP and BCM based on the damage assumption.
If it is a private home, assuming how much support and relief society will provide, I think that it is necessary to strengthen self-help if it seems that it is not very likely that assistance can be expected.
Please refer to the original for details.